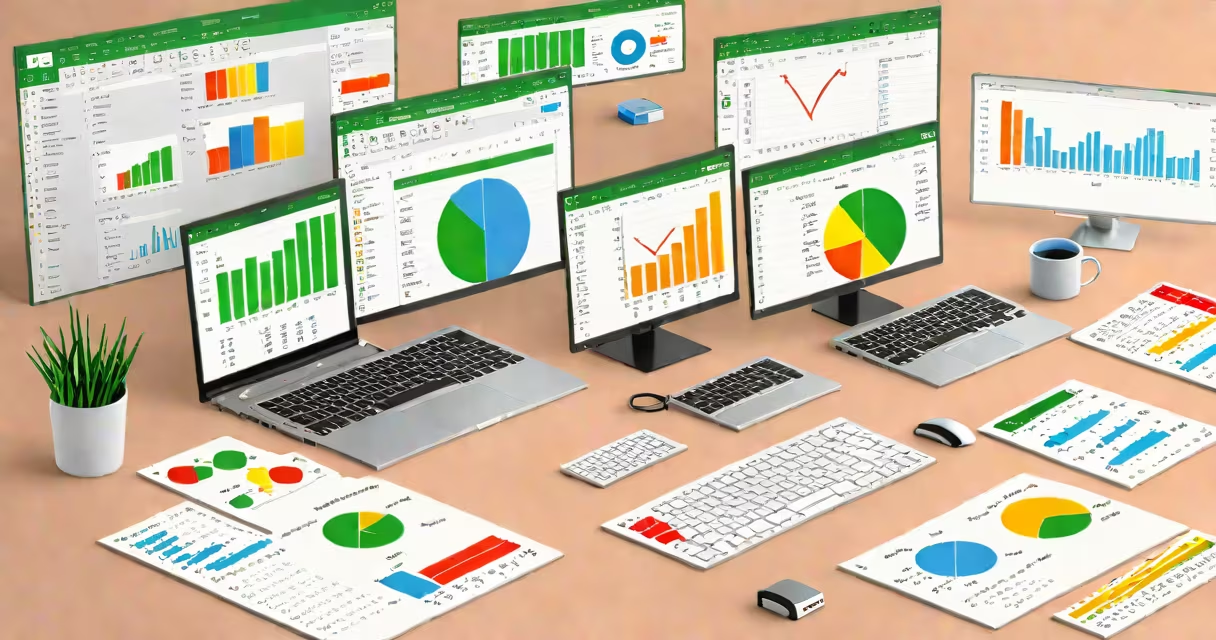
Excel is a spreadsheet application that lets you organize, calculate, analyze, and visualize data using rows, columns, and formulas. It supports tasks ranging from simple budgeting to complex forecasting, data cleaning, and automation through built-in tools and scripting.
Excel runs on Windows, macOS, iOS, Android, and in web browsers. It's part of Microsoft 365 and available standalone. The core function is structured data handling: enter numbers, text, dates, or formulas into cells, then manipulate them instantly.
For example, typing =SUM(A1:A10) in a cell returns the total of values in cells A1 through A10. This single action demonstrates how Excel turns raw input into changing output. No programming required.
Excel processes data through a grid of cells arranged in rows (numbered) and columns (lettered). Each cell holds one piece of data-text, number, date, or formula. Formulas reference other cells, enabling automatic updates when inputs change.
When you enter =A1*B1 in cell C1, Excel multiplies the value in A1 by B1. Change A1 or B1, and C1 recalculates instantly. This behavior underpins everything from payroll sheets to inventory trackers.
Advanced features include PivotTables, which summarize large datasets. For instance, a sales team with 10,000 transaction records can group data by region, product, and month with a few clicks. Results update dynamically when new data is added.
Excel includes dozens of built-in functions. SUM, AVERAGE, COUNT, and IF handle basic math and logic. VLOOKUP finds values across tables-critical for merging customer data with order history.
More useful tools include:
These tools don't require coding to use. But learning even basic VBA unlocks automation beyond standard features. For example, a user can write a script that imports data from a CSV file, cleans it, and generates a chart-all with one button click.
Many assume Excel is only for accounting. That's incorrect. While widely used in finance, it's also standard in marketing (tracking campaign ROI), HR (managing employee schedules), and science (analyzing lab results).
Another myth: Excel can't handle big data. It can manage up to 1 million rows per sheet. For larger datasets, use Power Query to import and clean data from databases, APIs, or cloud storage.
A critical distinction: Excel is not a database. It lacks relational integrity. If you need to link customer records across multiple sheets with constraints, use Access or SQL. But for most users, Excel's flexibility outweighs its limitations.
Consider a small business owner tracking monthly expenses. They create a sheet with columns for Date, Category, Amount, and Vendor. Using =SUMIF(Category, "Utilities", Amount), they extract total utility costs for the year.
Next, they insert a PivotTable to compare spending across categories. They filter to show only Q1 data and apply conditional formatting to show entries over $100. The result is a visual summary that reveals spending patterns at a glance.
They automate report generation by recording a macro that copies the PivotTable, pastes it into a Word document, and saves the file as "Q1_Report_2024.docx." This task takes seconds instead of minutes.
Another example: a researcher analyzing survey responses. They use Excel to remove duplicate entries, convert text responses to codes (e.g., "Yes" → 1), and run descriptive statistics. They generate bar charts to show response distribution.
These workflows are repeatable. Once set up, the same steps apply to new data sets. This consistency reduces errors and speeds up analysis.
Excel usage falls into four main categories:
| Use Case | Primary Tools | Best For |
|---|---|---|
| Basic Data Entry & Calculation | Formulas, AutoFill, Simple Charts | Budgets, personal tracking, school projects |
| Data Analysis & Reporting | PivotTables, Conditional Formatting, Charts | Business dashboards, performance reviews |
| Automation & Scripting | Macros (VBA), Power Query, Excel Add-ins | Repetitive tasks, data ingestion, exports |
| Advanced Modeling | Goal Seek, Solver, Scenario Manager | Financial projections, resource allocation |
Each category builds on the last. A user who masters formulas can move to PivotTables. Someone comfortable with macros can start building custom tools.
One non-obvious fact: Excel's formula engine evaluates expressions left-to-right, not by operator precedence. So =2+3*4 equals 14, not 20. This differs from standard math rules and trips up many beginners. Always test assumptions.
Excel integrates with external systems. You can pull data from Google Sheets, SQL Server, or SharePoint using Power Query. A retail manager might connect to a store's POS system via API, load daily sales into Excel, and generate a profit margin report.
Exporting data is equally straightforward. Save a worksheet as a CSV, send it to a colleague, or publish it to a shared drive. You can also export charts to PNG or PDF format for presentations.
I once automated a weekly inventory report for a warehouse. I wrote a Python script that pulled stock levels from a database, calculated reorder points using Excel's AND function, and saved the output as an Excel file. The entire process ran unattended overnight.
Excel is often compared to Google Sheets and LibreOffice Calc. All three support formulas and charts. But Excel leads in advanced features: Power Pivot, advanced error checking, and deeper VBA integration.
Google Sheets excels in collaboration. Multiple users can edit the same file simultaneously. But it lacks some Excel-specific tools like Solver and advanced chart formatting options.
LibreOffice Calc is free and open-source. It handles most common tasks but struggles with large files and complex macros. It's suitable for basic work but not enterprise-level analysis.
What can I do on Excel? The answer spans from entering a number to building predictive models. It's a tool for everyone-from students tracking grades to engineers simulating stress loads.
Start with a simple calculation. Build toward a dashboard. Learn one function at a time. The skills compound. After six months of consistent use, you'll handle tasks that once took hours in minutes.
Mastering Excel isn't about memorizing every function. It's about understanding how to combine tools to solve problems. automating reports, Excel delivers measurable results.