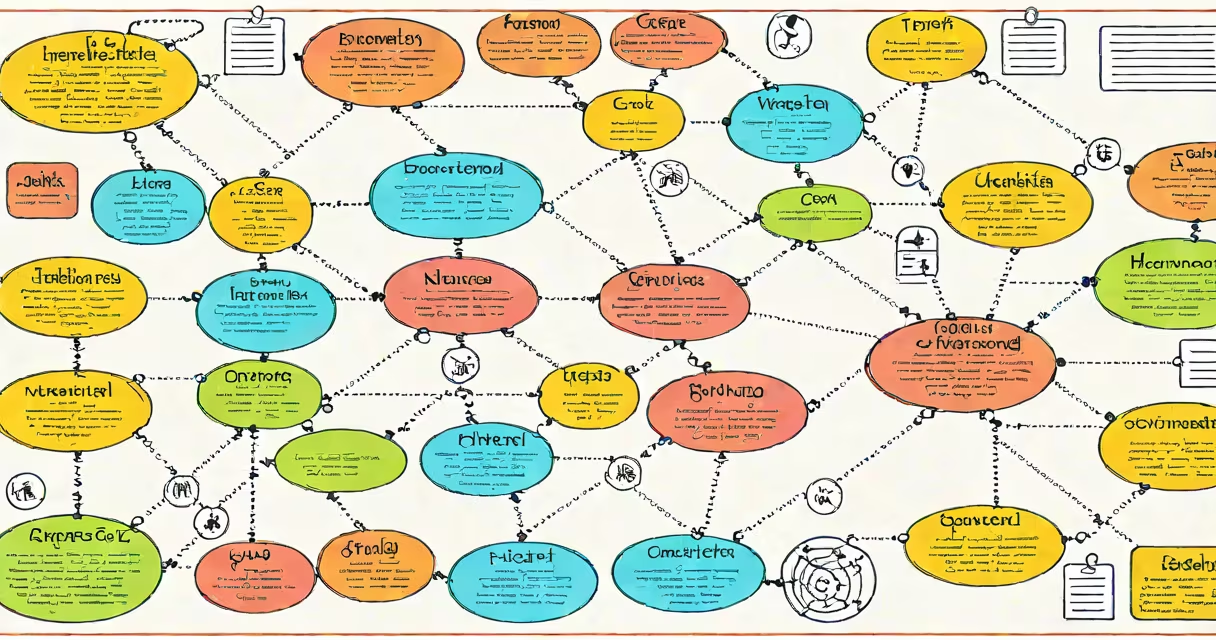
A graphic organizer in education is a visual tool that structures information to support student understanding, planning, and critical thinking. It presents concepts, relationships, and processes using diagrams, charts, or maps to make abstract ideas concrete and easier to process.
These tools are used across grade levels and subject areas-from elementary reading comprehension to high school science explanations. They reduce mental effort by organizing complex material into manageable, spatial formats that align with how the brain processes visual information.
According to the National Center on Accessing the General Curriculum, students who use graphic organizers show improved performance in reading, writing, and problem-solving tasks. The U.S. Department of Education's What Works Clearinghouse confirms that visual supports improve learning outcomes, especially for struggling readers and English language learners.
Graphic organizers function by externalizing thought processes. Instead of holding multiple ideas in working memory, students place them on a page with clear connections. This reduces cognitive overload and increases focus on relationships between concepts.
For example, a Venn diagram comparing two historical events forces students to identify similarities and differences side by side. A flowchart outlining the steps of photosynthesis breaks down a multi-stage process into sequential, visual blocks. Each element is placed intentionally to reflect logic, sequence, or hierarchy.
Research from the University of Kansas shows that students using graphic organizers during reading tasks recalled 30% more key details than peers using traditional note-taking. The visual layout enables quicker pattern recognition and better long-term retention.
There are several standard types, each suited to specific learning goals:
| Type | Best For | Example Use Case |
|---|---|---|
| Venn Diagram | Comparing and contrasting | Students compare two characters in a novel, listing shared traits and unique features. |
| Flowchart | Sequencing processes | Mapping the water cycle or the steps in solving a math equation. |
| Concept Map | Showing hierarchical relationships | Organizing the parts of a cell and their functions in biology. |
| T-Chart | Listing pros and cons | Assessing the benefits and risks of renewable energy sources. |
| Web Diagram | Brainstorming around a central idea | Generating ideas for a persuasive essay on climate change. |
Each format serves a distinct cognitive purpose. Flowcharts emphasize time or logical order. Concept maps show classification and subordination. T-charts promote balanced analysis. Choosing the right type ensures alignment with the task's goal.
Many educators assume graphic organizers are only for younger students or those with learning challenges. That's incorrect. High school and college students benefit from them too-especially when analyzing dense texts or preparing for exams.
Another mistake is treating them as fill-in-the-blank worksheets. When used passively, they fail to engage higher-order thinking. The most effective graphic organizers require students to interpret, analyze, and synthesize information-not just copy facts.
I once observed a 7th-grade class using a concept map to explore causes of the American Civil War. Students initially listed events like "slavery" and "states' rights." After discussion, they added causal links: "slavery led to sectional conflict, which intensified political division." The map evolved from a list to a network of reasoning-exactly the kind of deep engagement these tools enable.
They're not merely study tools. They're cognitive scaffolds. They support thinking in real time-during research, brainstorming, drafting, and revision. A student writing an argumentative essay might start with a T-chart to weigh evidence, then transfer key points into a flowchart to structure their argument.
When integrated into daily instruction, graphic organizers improve metacognition. Students learn to recognize patterns, anticipate connections, and revise their thinking. This is particularly valuable in STEM subjects, where identifying cause-effect chains or system interactions is essential.
For instance, in a middle school science unit on ecosystems, students used a food web diagram to track energy flow. They began with known species, then added decomposers and predators. As they adjusted relationships, they corrected misconceptions-like assuming all consumers eat plants. The visual model made errors visible and correctable.
Start small. Use a simple T-chart during a class debate. Have students fill in one side with evidence supporting a claim, the other with counterarguments. Then discuss gaps, biases, or missing perspectives. This turns a static chart into a changing thinking exercise.
Consistency matters. Over time, students internalize the structure. They begin using similar layouts independently-drawing quick webs during lectures or sketching timelines while reading. This builds habits of structured thinking beyond the classroom.
Graphic organizers are not a substitute for instruction. They are a bridge between input and understanding. When paired with clear objectives, teacher modeling, and guided practice, they become useful tools for equity, clarity, and deeper learning.
Understanding what is a graphic organizer in education reveals that it's not just a visual aid-it's a method of teaching thinking.